

How Leading Brands Use inReality to Understand Shopper Behavior
For many retail companies, the use of brick and mortar based analytics is a challenge. Reports are typically expensive and contain broad strokes of trends, cover general observation, and are rarely, if ever, actionable during the last 8 feet, at the actual point of sale fixtures. With retail evolving, many forward-looking brands have implemented new technologies into their retailing and marketing mix.
Adding sensors at the actual point of engagement, the shelf edge, has historically been cost prohibitive to deploy and maintain. And there’s always been the challenge with “what will I do with all that data?” With Radar Sensors, Camera Analytics, and Automated Insights, the inReality Analytics platform takes on those challenges directly and helps brands and retailers strengthen their image and influence shopper behavior in a better way.
From smartphones to clothing brands, many leading companies have realized that leveraging the power of retail analytics at the fixture level helps them create better signage around their products, engage their target audiences, and offer exceptional customer service. Before we dive into 3 prime examples of inReality’s solutions, let’s have a look at the benefits that retailers and brands can reap.

Top Brands Using inReality
Retailers can make better and more efficient decisions by integrating sensor technologies which allow managers to move away from gut feel to data-driven decision making. Here are the examples where using inReality makes an impact.
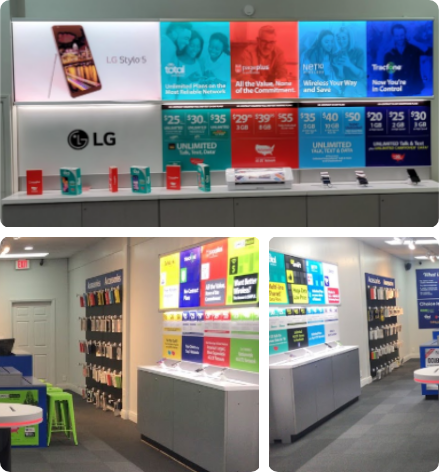
Major Mobile Phone Retailer
A major mobile phone retailer turned to inReality’s solutions to boost customer engagement. They wanted to explore the effect of external marketing campaigns on customer traffic to certain product areas.
Using the inReality platform, they incorporated door counters to measure traffic at the entrance as well as 3 key areas of interest. This helps them to gauge traffic, engagement, and impact.
In this way, they can pinpoint which external promotions affect shopper behavior. The inReality solution allows retailers to measure and analyze their traffic, see which areas of the store receive the most traffic, and measure the effects of various promotions. It also allows retailers to optimize their displays to convert customers, with easy to read performance scores and automated insights.
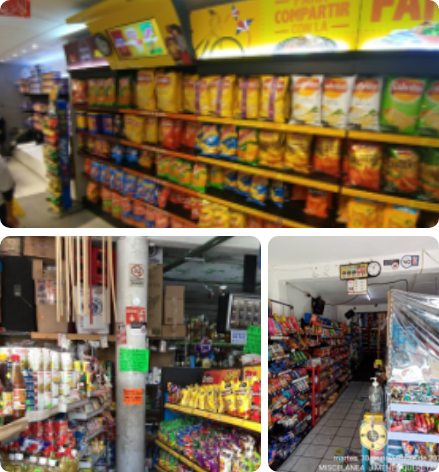
Major Snack Brand
This Major Snacks Brand takes customer engagement and pricing strategy to the next level with inReality radar sensors that help them measure customer traffic, engagement, and impressions on their retail fixtures.
They placed radar sensors on end caps and next to advertising signage to influence their in-store marketing spend by understanding which spots are most active. Doing this helps them maximize the impact of their marketing dollars and increase profits and market share.
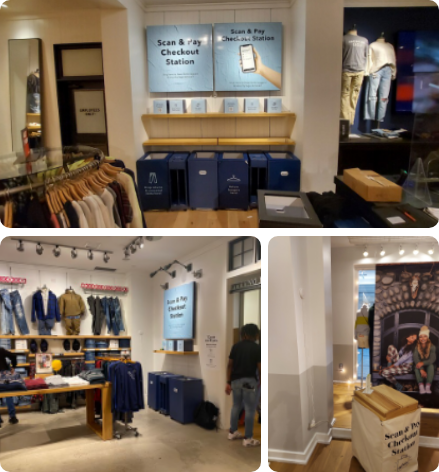
Major Clothing Retailer
With a data-driven culture as well as owning its product fulfillment, this retailer is always quick to respond to customer needs. To embrace self-checkout options for shoppers, the company installed a radar sensor in this self-service area.
The inReality Sensor Solution helps them understand which design set-ups/layouts have the most customer engagement. Using the inReality platform, they have been able to improve its key numbers, improve shopper satisfaction at self-checkout, and further optimize their signage. Further, the insights enable them to better make key decisions after understanding what is statistically and factually more effective.
Conclusion
We believe making data easier to accumulate, understand, and actionable is our purpose. With the inReality platform, you can use retail analytics to increase customer engagement, drive more traffic and make key decisions based on facts over gut-feel. The inReality Performance Score metric aggregates multiple data points into one easy to understand metric, and when combined with our easy to install Radar Sensor, you have a path to the industry’s first game changing metric which finally makes retail analytics actionable at the shelf edge.
Benefits of InReality in Retail
1. InReality Performance Score
With the inReality Performance Score, understanding the effectiveness of a point of sale fixture has never been easier. It aggregates all the key “top of the funnel” in-store shopper behavior metrics, such as Traffic, Impressions, Engagement, and dwell, into one, easy to understand score. When combined with an annotated timeline of your initiatives, such as changes in fixture graphics, promotional campaigns, or price changes, an objective score is available to assess their impact.. When segmented by fixture attributes, store types, or specific locations, guidance on ways of creating iterative improvements is made clear, leading to higher key performance indicators and more sales.
The Score, which is fully customizable, is commonly built on 4 general categories:
a. Shopper Count
The two metrics Traffic and Impressions clue you in on the volume and quality of the shoppers going by your fixture.
Why does it matter?
Understanding how the fixture performs in the specific store location can lead to changes in position, wayfinding signage, or even nearby anchor products.

b. Engagement
There are three metrics that are used to determine the level of engagement associated with the fixture, each providing a different nuance to capture the impact of implemented changes
Why does it matter?
Understanding which attribute of engagement is impacting a score the most, and comparing to other similar locations help you determine best practices and make changes to the challenged locations such as product packaging, shelf placement, attract loop on digital content, and much more.

c. Abandonment Rate
This metric is synonymous to the Abandonment Rate on websites. It represents the percentage of shoppers who were close enough to engage, passed the impression criteria, but still did not engage.
Why does it matter?
Understanding if the score is impacted by shoppers who were initially attracted to the product, but either gave up or did not see enough value will expose issues such as the features or value proposition are not clear, or if pricing is too high.

d. Volatility
This metric exposes the consistency of engagements throughout a typical day.
Why does it matter?
Understanding the swing of engagement count spikes and dips provides important guidance on staffing needs for areas associated with considered purchase products.
2. InReality Analytics
With inReality Analytics, brands and retailers alike are able to remove the guesswork from making strategic business decisions. Gaining the abaility to quickly identify opportunities and areas for improvement. With inReality’s technology, you can:
- calculate foot traffic into an area to help determine the appropriate investment level for the space
- assess in-store or external promotions to determine which are influencing shopper behavior
- A-B test digital screen content to drive engagement for higher-margin product
- confirm your signage is driving traffic, even if your not seeing the conversions
- determine the areas with the most traffic and engagement for placing higher margin products
- identify the products which are getting engagement, but not actually selling because the size/options/price was not right
3. Radar Sensors
In retail, radar analytics can help stores thrive and survive. Just like camera analytics, they effectively measure fixture performance and shopper engagement at the points of decisions, but without any privacy challenges as it does not use a camera nor track cell phones. You can monitor performance with an actionable dashboard that allows informed decisions. The metrics captured contribute to improving sales per square foot, identifying underperforming products, boosting profitability, and maximizing productivity through optimal placement of products. The sensor is available as a stand-alone unit – just add power and connect to wi-fi, or as a USB plugin to an existing media player.
Please contact us through

Online Quote Form
Fastest Custom Quote
Fill out our secure quote form with what you’d like to order – type, size, quantity, location, and desired turn time. We’ll get back to you promptly.
Quote Via Phone
Most Detailed Quote
Please call to discuss your requirements with one of our skilled Customer Service Representatives.
Email RFQ
Traditional Request for Quote
Please attach any files, information, and questions you may have to an email and send it to your inReality Salesperson or Customer Service Representative. Include your requirements, quantities, and turn time desired.
