


Who
Store designers and Merchandisers
What
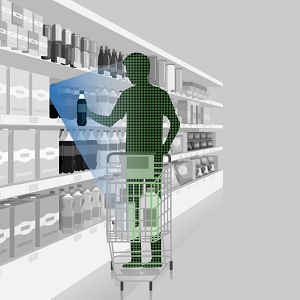
Measure and report footfall and shopper behavior around fixtures
Why
The collected data drives data driven decision making on product display layout, the testing of new products, planogram evaluations and effectiveness of marketing campaigns.
How
Integrate a sensor in each of the fixtures, along with a common cell modem for internet connectivity.
Top 8 reasons why measuring engagement will improve your store's ROI
Determine actual foot traffic
into an area to help determine appropriate investment level for the space
Consider making changes to the product mix or promotional pricing
if signage is driving engagement to the area, but your not seeing the conversion
Perform A-B testing
on designs, position, product mix and signage content
Select the right placement for the display
Identify the areas with the most traffic and engagement
Move up or delay content refresh
based on a change in engagement levels
Identify the products which are getting
engagement traffic and dwell, but not actually selling because the size/options/price is not right, then make changes.
Measure the impact and rate marketing effectiveness
of all internal and external promotions and ad campaigns to help form future design, timing, and execution decisions
Research best practices
Compare overall and specific area performance across individual stores, identify best practices to implement across network.
Why inReality’s Engagement Tracker?

Simplicity
There is no simpler, more cost effective, sensor that provides this depth of insight in the market today

Privacy

Security
Built on industry leading cloud platform providing a secure and manageable way to access your data
